Starting with an index card full of items to include, I tried to make a map of basic feedbacks relating to climate change. I got this far, then decided that it probably cannot be done in two dimensions, except perhaps on a really massive sheet of paper:
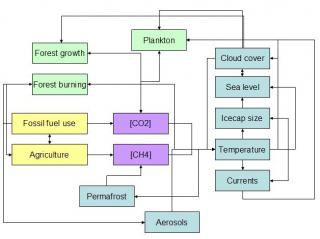
Note: a chemical formula in [square brackets] indicates the concentration of that substance.
Consider, for instance, a single pathway of effects. Agriculture uses fossil fuels, which produce CO2. The CO2 raises global temperature, affecting global cloud cover in an uncertain way. The cloud cover affects temperature, by reflecting more or less solar radiation back into space. It also affects the rate of forest and plankton growth (as does the original increase in CO2).
All told, you need to account for phenomena in the following domains: atmosphere (gas concentrations, cloud effects), hydrosphere (ocean density, temperature, currents), cryosphere (ice and glacier levels, permafrost), and biosphere (plant growth, forest fires). Add to that feedbacks within human behaviours (agriculture and forest burning, for instance) and feedbacks between anthropogenic and non-anthropogenic sources of climate change, such as volcanic eruptions (lithosphere) and changes in orbits and solar output. Doubtless, I have overlooked and forgotten many relevant effects, also.
My hat goes off to the producers of general climate models (GCMs) that have started to incorporate the most important of the linkages shown above. These complex dynamic systems are tricky things, not easily dealt with through the general tendency in science to break questiond down and understand them bit-by-bit.