Odds guessing results

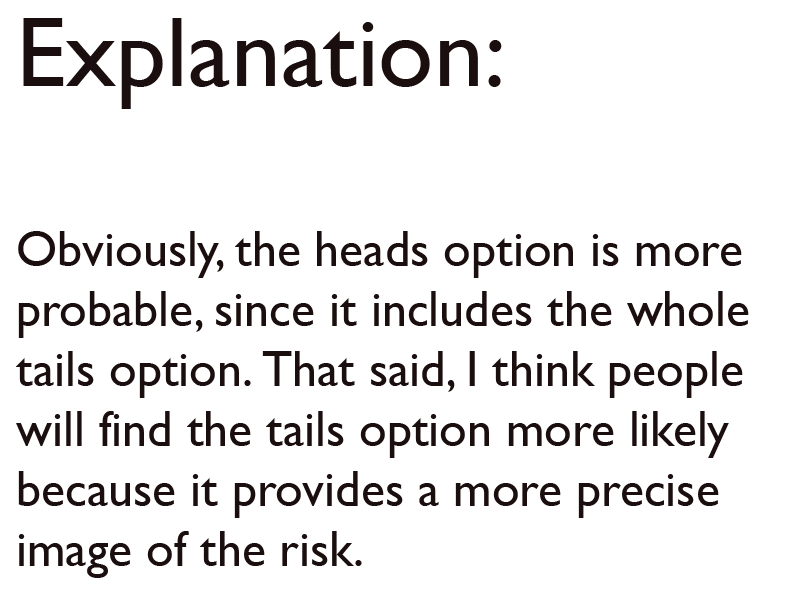
Thanks in a large part to Zoom (of Knitnut.net), I have received 54 valid responses to my odds guessing experiment. As those who read the explanation already know, the point of the experiment was to assess how people assess the relative risks of a vague but more probable outcomes versus a concrete but less likely one. The vague result (1,000 deaths from flooding somewhere in the United States this year) was assigned to ‘heads.’ The precise result (1,000 deaths from Florida hurricane induced flooding) was assigned ‘tails.’

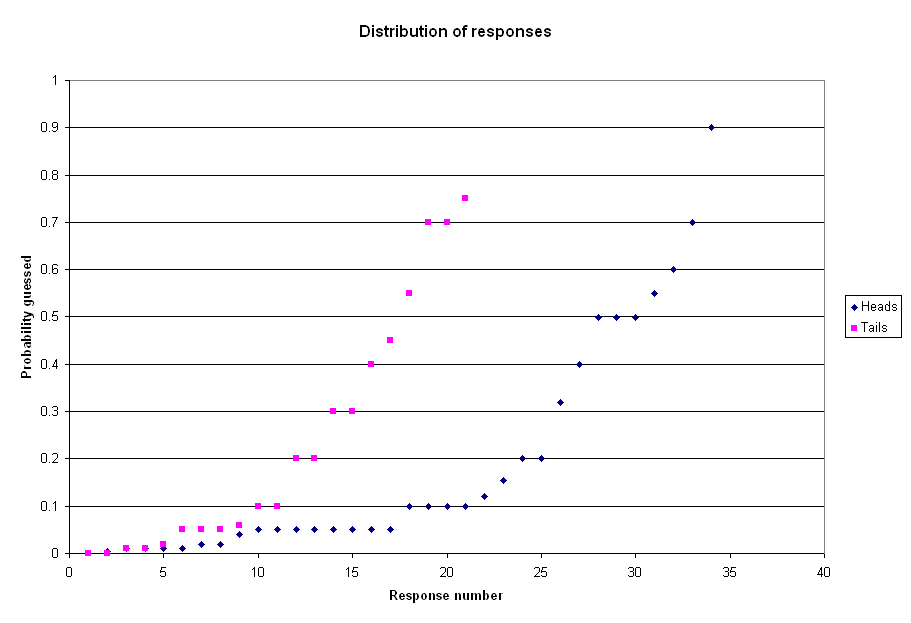
The first result to note is the very wide disparity of answers. Responses for ‘heads’ ranged from 0.005% all the way up to 90%. Responses for ‘tails’ ran from 0% to 75%. Given that there has been no flood in American history that killed 1,000 people, it seems fair to say that most guesses are overestimates. That said, the point of the experiment was to judge the relative responses in the two cases, not the absolute accuracy of the responses. This scatterplot shows the complete set of responses for both questions.

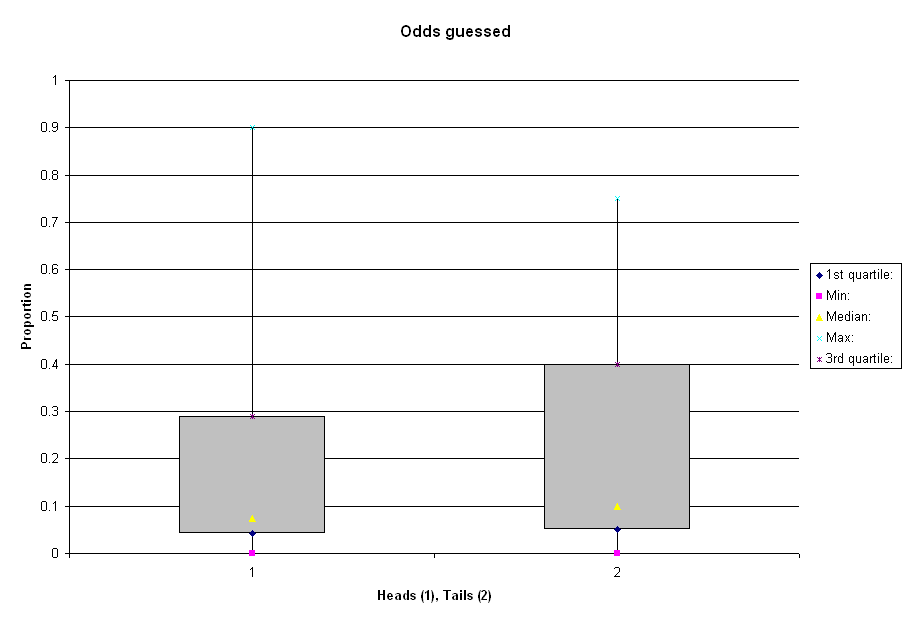
The mean probability estimate for ‘heads’ was 19.3%, while that for ‘tails’ was 23.8%. Because there were a large number of very high and very low guesses, it is probably better to look at descriptive statistics that aren’t influenced by outliers. This boxplot shows the mean, first and third quartile, maximum, and minimum results for each. To understand box plots, imagine that all the people who guessed are made to stand in a line, ranked from highest to lowest guess. Each of the numbers described previously (quartiles, etc) correspond to a position in the line. To find something like the median, you locate the person in the very middle of the line, then take their guess as your number. The advantage of doing this is that it prevents people who guessed very high from dragging the estimate up (as happens with the mean, or average), and doing the same with those who guessed very low.

The yellow triangle is the median. For ‘heads’ the median was 7.5%, compared to 10% for tails. The gray boxes show the range of guesses made by half the sample. At the top is the guess made by the person 3/4 of the way up the line, and at the bottom is the one made by the person 3/4 of the way down the line. As you can see, the bottom half ot the range looks pretty similar. Half of people estimate that the risk of both the ‘heads’ and ‘tails’ outcome is between about 10% and about 0%. What differs most about the two distributions is the upper portion of the grey boxes. Whereas 75% of respondents thought the ‘heads’ option was less than 30% probable, that value was more like 40% for the ‘tails’ option.

A couple of problems exist with this experimental design. Among the 54 ‘coin tosses,’ 63% seem to have come up heads. While it is entirely possible that this is the result of fair throws, I think there is at least some chance that people just chose ‘randomly’ in their heads, in a way that favoured heads over tails. Another problem is that some people might have looked at the comments made by others before guessing, or may even have searched online for information about flooding probabilities.

In conclusion, I would say the experiment provides weak support for my hypothesis. It is undeniably the case that the ‘heads’ option is more likely than the ‘tails’ option, and yet both the mean and median probability assigned to ‘tails’ is higher. There are also significantly more people who assigned ‘tails’ a risk of over 10%.

Those wanting to do some tinkering of their own can download the data in an Excel spreadsheet.

[Update: 28 April 2008] There has been some debate about the point above about the slight heads-bias in the results. I am told that the odds of this outcome are one in 26.3. Whether random chance or a systemic bias better explains that, I will leave to the interpretation of readers. In any event, it only really matters if the ‘heads’ group and ‘tails’ group differed in terms of their natural perception of risk.

Thoroughly impressed by TED

Steel girders and sky

Initially drawn in by the Al Gore video, I have been watching lots of the films from the TED conference, and being impressed by many of them. I am more impressed than ever by cephalopods, and some of my idle curiosity about how ants decide what to do has been satisfied. I also learned about some new reasons for which we should be wary about the long-term use of antidepressant drugs.

Putting these short lectures online is an excellent way of demonstrating the power of the internet to distribute ideas. Even for those of us who would balk at flying to California to attend some very neat talks, fiber optic links provide a low-carbon alternative.

Information for Oxford freshers

Quite a number of people (mostly Canadians) have been contacting me recently with questions about Oxford. In an effort to aid them, I am working on a new page on the wiki:

General information about Oxford

The aim is to express – in a concise form – some of the things I have learned about Oxford as a place and as a school. It includes fairly brief sections on funding, accomodation, the city, and Wadham College. Information on my specific program (the M.Phil in International Relations) and on my thesis can be found through this wiki page.

Those with comments about the content of the page – or suggestions about things to add – should feel encouraged to leave comments on this blog post.

Hurricanes and climate change action

Bike beside the Rideau Canal in spring

At several points in the past, I have mentioned the possibility that the majority of people will not be willing to accept serious action on climate change until at least one big, unambiguously climate related disaster has taken place. The same point is made in Joseph Romm’s book but, whereas I have speculated that it could be vanishing icecaps or large-scale climate induced human migration in Asia, he seems to think that Atlantic hurricanes striking the United States may make the difference.

There is good reason to find this plausible. The strength and frequency of hurricanes both have a lot to do with sea surface temperature (SST). While it isn’t feasible to attribute the occurrence or harmfulness of a particular storm to climate change, it is relatively easy to show a correlation between rising global temperature, rising SST, and more severe hurricanes. Simulations conducted by the U.S. National Oceanic and Atmospheric Administration Geophysical Fluid Dynamics Laboratory led to them concluding that “the strongest hurricanes in the present climate may be upstaged by even more intense hurricanes over the next century as the earth’s climate is warmed by increasing levels of greenhouse gases in the atmosphere.” Within decades, rising SSTs could make the kind of extraordinary hurricane seasons that have proliferated since 2000 the low end of the new scale.

This matters partly because a hurricane-climate change connection would affect Americans directly and very visibly. Insurance prices would rise further, at the same time as more areas became uninsurable and serious questions arose about whether to rebuild at all in some places. The cost trade-offs between insurance, protective measures like higher levees, and storm risk would be thrown into sharp relief. The perceived damages associated with climate change would also shift from being associated with people outside of North America at some distant point in the future to being both physically and temporally immediate.

Obviously, it would be better if serious measures to combat climate change (eliminating non-CCS coal, pushing hard on energy efficiency, building dramatically more renewable capacity, etc) could come about simply as the result of a reasoned assessment of the IPCC’s scientific conclusions and projected associated costs. If, however, it is going to take disasters before people and politicians are ready to embrace real change, we should hope that they will come early, carry a relatively small cost in human lives, and not exacerbate the problem of climate change in and of themselves, as fires and ice loss do.

Google transit in Vancouver

Google Transit has now been rolled out for a few Canadian cities: namely, Vancouver, Montreal, and Fredericton. I tried asking it about a dozen or so common transit trips in Vancouver and it seemed to be both fast and accurate. For example, here is how to get from Edgemont Village, in North Vancouver, to the Tsawwassen Ferry terminal. Here is how to get from White Rock to Horseshoe Bay. It also knows about the Skytrain.

It is also much less bothersome than the proprietary transit webpages built by people like Translink and STM. I hope it gets rolled out for Ottawa and Toronto soon.

The Japanese version is especially impressive. It includes buses, trains, ferries, and domestic air travel.

Telecom immunity and the rule of law

Black lagoon pinball machine

A recent article in Slate discusses how legal policy in the United States should be fixed in the post-Bush era. There are many things in it with which I wholeheartedly disagree. Perhaps the most egregious case is in relation to providing immunity to telecom firms that carried out illegal wiretaps for the administration. Jack Goldsmith argues:

Private-industry cooperation with government is vital to finding and tracking terrorists. If telecoms are punished for their good-faith reliance on executive-branch representations, they will not help the government except when clearly compelled to do so by law. Only full immunity, including retroactive immunity, will guarantee full cooperation.

I think the bigger danger here is providing a precedent that firms can break the law when asked by the administration, then bailed out afterwards. Only fear of prosecution is likely to make firms obey the law in the first place. Providing immunity would invalidate the concept of the rule of law, and open the door to more illegal actions carried out by the executive branch. “Full cooperation” is precisely what we do not want to encourage.

If government wants to intercept the communication of private individuals, it must be a policy adopted through the due course of law. People need to know what it involves (though not necessarily the details of exactly how it works), who supported it, and how those supporters justified the choice. Greater security from terrorism at the cost of a more opaque and lawless state is not a good tradeoff. Company bosses should fear that they will be the ones in the dock when evidence emerges of their engaging in criminal acts, regardless of who asked them to do so. The alternative is more dangerous than the plots that warrantless wiretapping sought to foil.

Getting a gravatar

People reading comments recently will have noticed that this site now supports Gravatars. (Globally Recognized Avatars). These little pictures go beside any comments you leave, allowing you to express yourself a bit and others to identify you at a glance.

Getting one is free and easy and is done from the site linked here. Once you have one, it will appear beside all the comments left on this site using your email address, as well as on all other sites that have Gravatar support in place.

[Update: 5 May 2008] I am trying out Identicons as a default image for those without Gravatars. They are automatically generated based on IP address and may make conversations with many commenters easier to follow.

WordPress 2.5

WordPress 2.5 doesn’t look much different from the perspective of the reader, but the administrative controls are much slicker. Upgrading seems to be relatively painless, and my plugins seem to work.

One really nice thing is that you can now change the default thumbnail size from within the interface (under Settings > Miscellaneous). My thumbnail size hack can now be cheerfully thrown into the dustbin of historical code.

I remain impressed that the WordPress team continues to produce such excellent free software – the best blogging platform available.

[Update: 14 Apr 2008] WordPress 2.5 seems to have a lot of bugs. Often, it hangs when I try to post comments, then tells me the comments are duplicate. I am getting lots of Error 500 pages. Sometimes, when I make a post WordPress says that it failed. It then becomes a draft with random incorrect categories attached to it.

The new page for writing posts has an awkward layout. The scheduled posts page doesn’t show the time when posts will appear. The image uploader sometimes refuses to let you add titles or descriptions to things you just uploaded, with the option to insert them into posts similarly vanished.

Hopefully, a new version that fixes all these issues will emerge soon.

[Update: 15 Apr 2008] The Flash uploader in WordPress 2.5 is quite terrible.

Photoshop express

Adobe has released a free web-based version of their most popular image editing program, called Photoshop Express. The software allows for a number of fairly basic modifications, including cropping, exposure correction, saturation and white balance changes, and sharpening. One nice touch is that it does allow the conversion of images to black and white using any of several virtual colour filters. The free service includes two gigabytes of storage, and seems to include mechanisms for integrating with Facebook, Photobucket, and Picasa.

The web version has nothing on the full version of Photoshop – lacking tools like levels and curves, not to mention paths, masking and the thousands of other things that make Photoshop so versatile. That said, it’s a nice thing to be able to use in a pinch, when nothing more capable is readily available.