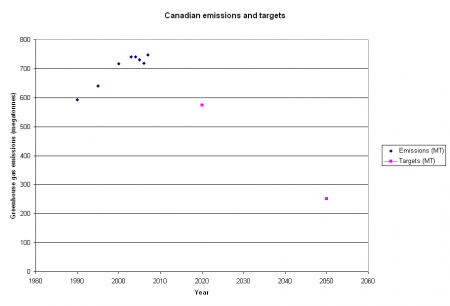
Back in May 2008, the figures for Canada’s 2006 emissions were released. They were made into a graph for a previous post. Now that the 2007 figures are available, the chart can be extended to show the 4% jump in emissions, putting Canada 26.2% above its 1990 level of emissions and 33.8% above its Kyoto Protocol target. In order to meet our target of cutting to 20% below 2006 levels by 2020, we will need to cut Canadian emissions by around 170 MT during the next eleven years.
The causes of the increase are also described:
“Between 1990 and 2007, large increases in oil and gas production – much of it for export – as well as a large increase in the number of motor vehicles and greater reliance on coal electricity generation, have resulted in a significant rise in emissions.”
Between 1990 and 2007, emissions rose by a total of 155 million tonnes (MT). 143 of those were from energy industries, including transportation and the oil sands. By contrast, residential emissions have basically been flat since 1990.


This is a depressing thing to see on Earth Day.
While we talk, Canada’s emissions go up, up and up…
JEFFREY SIMPSON
From Wednesday’s Globe and Mail
April 22, 2009 at 12:00 AM EDT
Up, up and up. Our greenhouse-gas emissions just keep going up, and no government seems able or willing to reverse the trend.
From 2004 to 2006, emissions actually declined in Canada, from 741 million tonnes to 718 million, a drop explained by one-off developments and mild winters. But, in 2007, emissions jumped 4 per cent, resuming the upward march that began in 1991.
Environment Canada, in a required annual filing to the United Nations, says “long-term growth remains significant. Between 1990 and 2007, large increases in oil and gas production – much of it for export – as well as a large increase in the number of motor vehicles and greater reliance on coal electricity generation, have resulted in a significant rise in emissions.”
This new data provides a nice electoral point for opposition parties. Namely, that the old Liberal policies were starting to work but the Tories ended them and replaced them with ineffective efforts at curing emissions.
That may not be entirely fair, however. Would the Liberals really have slowed the pace of oil sands development?
Of course, these results make this into a bit of a sad joke:
Canada’s Environment Minister Salutes Canadians for Their Commitment to the Environment